
To read and use Instagram Insights, switch to a Professional account, open the Professional dashboard from your profile, tap See all insights, and judge your content by Views, Reach, Interactions and Followers instead of likes alone. Start with the last 30 days, compare the views that came from your followers against the views that came from people who don’t follow you, then open individual posts and Reels to see which ones earned saves and sends. That is the whole loop.
The rest of this guide covers where every number lives, what each one counts now that Instagram has replaced Impressions with Views, and which decision each metric should change. I wrote it as a working guide rather than a glossary, so every section tells you where to tap, what the number means and what to do with it.
What Instagram Insights Is and Who Can Use It
Instagram Insights is the free analytics tool inside the app, and Instagram’s Help Center states that it is available only for business or creator accounts. If you are on a personal profile you won’t see it anywhere, and that is the most common reason people think the feature has disappeared.
Switch to a Professional account
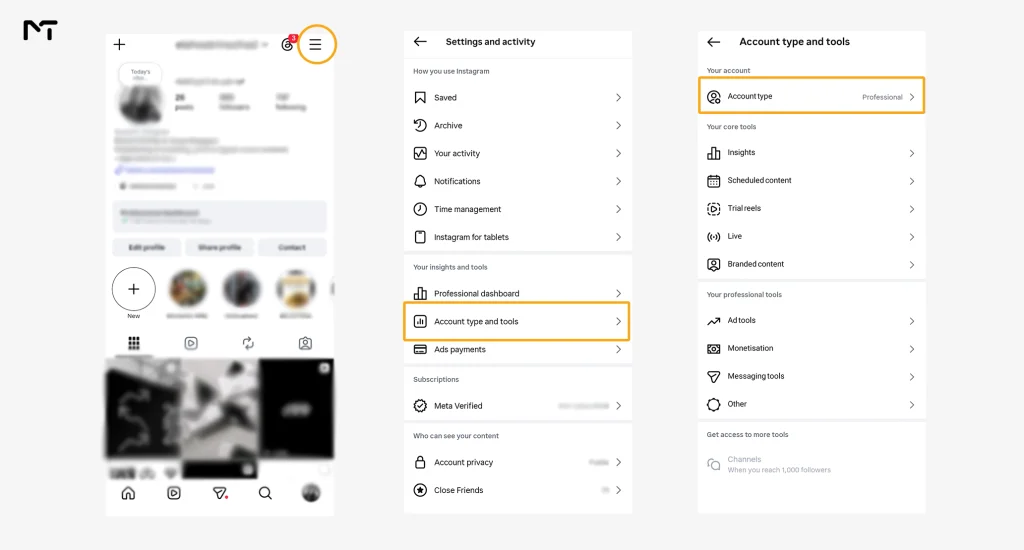
Open Settings from your profile menu, find Account type and tools, and choose Switch to professional account. You can pick Creator or Business. Both include Insights, so choose the one that matches how you present yourself.
Two limits are worth knowing before you start. Insights only cover content you publish after the switch, so older posts stay blank. Some sections also have minimums: the Followers section needs at least 100 followers before Instagram shows it. If you plan to grow an account, switch early so the data starts collecting from day one.
Where to Find Instagram Insights
Instagram keeps account level numbers in one place and content level numbers in another. Knowing which screen you are on saves a lot of confusion later, because the same metric can tell you something different at each level.
Open account Insights from your profile
- Open your profile in the Instagram app.
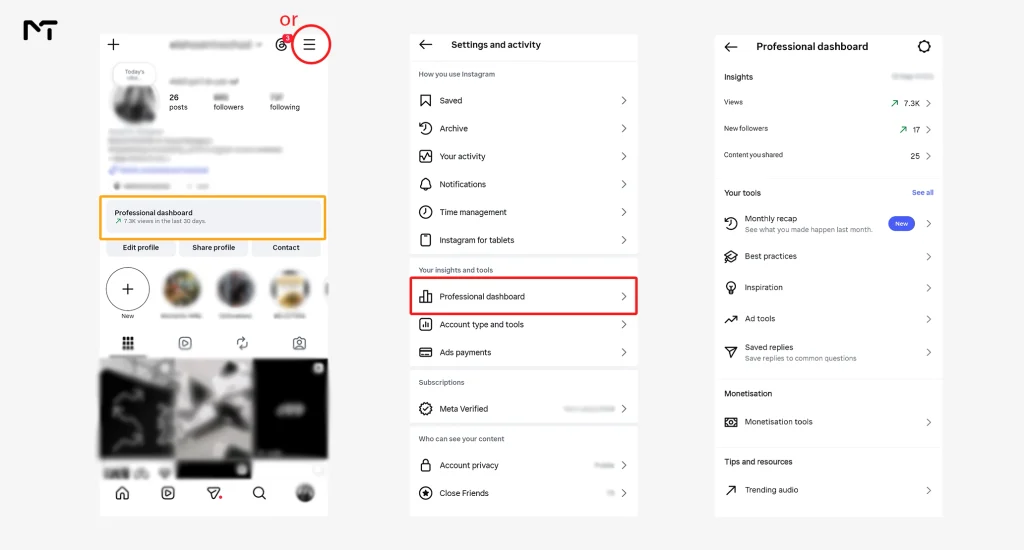
- Tap Professional dashboard near the top of the profile. If you don’t see it, open the menu in the top right corner and look for Professional dashboard under Your insights and tools.
- Tap See all insights.
- Choose your date range at the top of the screen.
The dashboard opens with your performance for the last 30 days, which is a sensible default for spotting trends.
Open Insights for a single post, Reel or Story
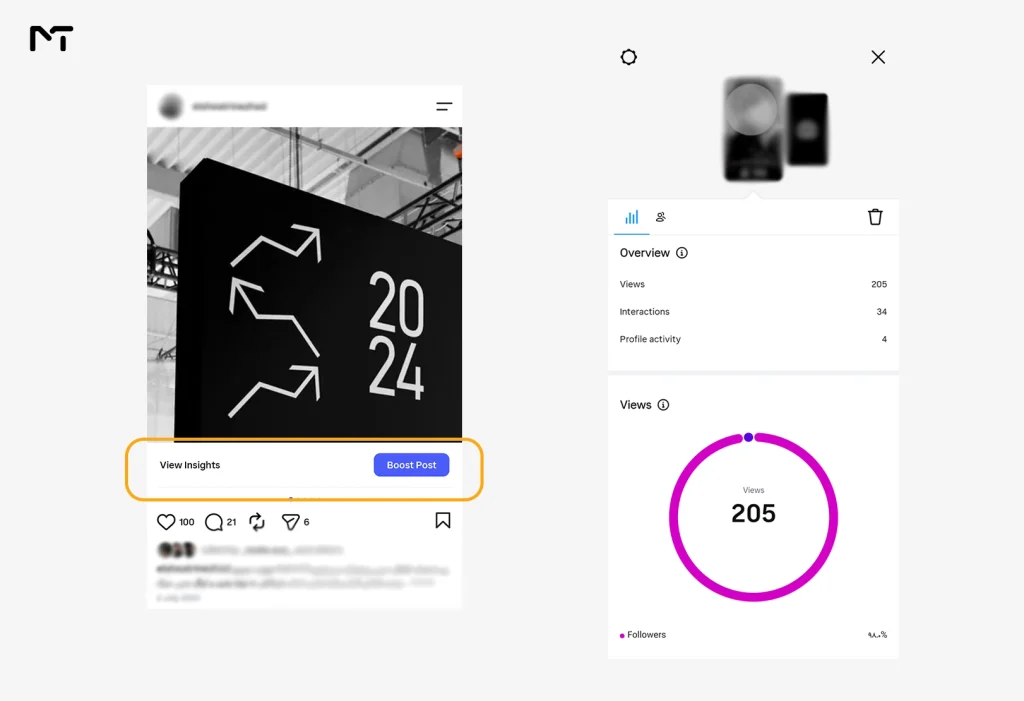
Tap View insights under a post or Reel. For a Story, swipe up while you are watching it. Stories older than 24 hours are available from the Insights section of the Professional dashboard.
Check Insights from a computer
Instagram’s Help Center describes Insights as a feature of the mobile app. If you manage a Business account that is connected to a Facebook Page, Meta Business Suite is the route many people use to see Instagram performance on a desktop screen. Expect the layout to look different from the app.
How to Read Instagram Insights Section by Section
Instagram has renamed and rearranged this screen more than once, so labels may differ a little depending on your app version. The logic underneath doesn’t change: how many people saw your content, what they did, and who they are.
| Metric | What it counts | How I use it |
|---|---|---|
| Views | Every time your content is played or displayed, repeat views included | Measures the total visibility of a post, Reel or Story |
| Reach | Unique accounts that saw your content, each counted once | Shows how many different people you actually touched |
| Interactions | Likes, comments, saves, shares and replies | Shows what people did, not just what they saw |
| Followers | Growth, top locations and when your followers are most active | Shows who your audience is and whether it is growing |
| Profile activity | Profile visits and link taps, where your account shows them | Connects content to the actions a business cares about |
Views and Reach after the Impressions change
Impressions no longer appear in Instagram Insights. Meta retired the metric in 2025 and made Views the standard measure across posts, Reels and Stories. Views count every display of your content, repeats included, and for Reels they cover video starts and replays. Reach is different because it counts each account only once, so ten views from one person is ten views but a reach of one.
This matters when you compare time periods. Analytics providers that tracked the switch reported that Views for photos and carousels can come out higher than the old Impressions numbers, since each carousel image can count separately. So don’t compare a 2026 Views figure with a 2024 Impressions figure and call the difference growth. If you also run paid campaigns, Meta Ads Manager may still report impressions for your ads, which is a separate system from Insights.
Unique accounts that saw your post so each person counts exactly once
Total times your post was displayed including replays by the exact same person
Views from followers and from people who don’t follow you
Instagram splits Views and Reach between followers and people who don’t follow you. I think this is the most useful split in the whole dashboard. When most of your views come from followers, your content is serving the audience you already have. When a big share comes from people who don’t follow you, your content is being recommended beyond your circle, usually through Reels and Explore. Neither result is wrong. It depends on whether you are trying to hold your audience or grow it, and the split tells you which one you are doing right now.
Interactions are not all equal
Insights groups likes, comments, saves, shares and replies under Interactions, and the total can hide a lot. A like takes a second. A save means someone wants to come back to the post, and a share means they thought of a specific person. When I compare two posts with similar likes, I look at saves and shares first, because they usually explain why one post kept travelling after the first day.
Sometimes you might notice a sudden drop in Story interactions and wonder if your content is failing. Before changing your entire strategy you should verify your account settings because a simple privacy glitch is often the real reason why people can’t reply to your Instagram Stories.
Stories demand a slightly different approach because they come with unique navigation behaviors. When you look at the numbers for an active or past Story you must pay close attention to taps forward, taps back and exits. A high number of exits means people got bored and left their feed completely. Taps back are the actual gold standard because they show someone found your slide interesting enough to read twice or wanted to catch a detail they missed. Watching these specific habits tells you exactly how many slides your audience will tolerate before they move on to someone else.
Followers
The Followers section shows growth, where your followers live and when they are most active. Use the active times as a starting point for scheduling, then test them against your own post results instead of treating them as a rule. Read growth as gained versus lost, not just the net figure, because a flat net number can hide a lot of churn. Location and active times are helpful basics but the demographics tab also breaks down the precise age ranges and genders of your audience.
Knowing whether you are talking to teenagers or professionals in their forties completely shifts how you should write your captions and design your visual elements. You might think you are making content for one specific group but this data often reveals that a completely different demographic is actually connecting with your message.
Once you identify your true audience demographic creating targeted messaging becomes much easier especially if you utilize the best Telegram AI bot to write Instagram captions that perfectly match their specific tone and preferences.
Profile visits and link taps
If you sell something or send people to a website, this is where content turns into action. Divide profile visits by reach to see how many people were curious enough to tap through. Divide link taps by reach to see how well your call to action works. Track your own baseline for a month before judging any of these numbers, since there is no universal benchmark that holds across niches.
The Three Numbers Instagram Tells You to Watch
Plenty of guides list twenty metrics and leave you to guess which ones count. Instagram’s own head, Adam Mosseri, narrowed it down in January 2025. He said the signals that matter most for ranking are watch time, likes and sends, and he told creators to look at average watch time, likes per reach and sends per reach in their Insights. He also noted that likes carry slightly more weight for content shown to people who already follow you, while sends carry slightly more weight for people who don’t.
| Number | Where it comes from | What it tells you |
|---|---|---|
| Average watch time | Open a Reel and tap View insights | Whether your opening and pacing hold attention |
| Likes per reach | Likes divided by reach | How many of the people who saw it liked it |
| Sends per reach | Sends divided by reach | How often people passed it on privately, which matters most for reaching new people |
Here is a quick example with made up numbers. Two Reels both reach 5,000 accounts. Reel A gets 150 likes and 10 sends. Reel B gets 90 likes and 60 sends. Reel A has the higher likes per reach at 3 percent against 1.8 percent, but Reel B has the far higher sends per reach at 1.2 percent against 0.2 percent. At a glance Reel A looks like the winner. Reel B is the one more likely to travel to people who don’t follow you yet.
Looking at your average watch time gives you a solid baseline but the audience retention graph shows you exactly what happened second by second. When you open the analytics for a specific Reel, scroll down to find the retention chart which reveals the exact moment people swiped away. If half your viewers leave during the first three seconds your initial hook is failing to grab their attention. If the line drops sharply at the very end you might be dragging out your call to action. Finding these drop off points helps you edit your next video to keep people watching longer.
Instagram runs separate ranking systems for Feed, Reels, Stories and Explore, so treat these ratios as a way to compare your own posts with each other, not as a score Instagram hands you.
How to Use Instagram Insights to Make Decisions
Reading the numbers is half the job. The other half is tying each one to a decision, and that is where most accounts stall.
Instagram Insights Action Cheat Sheet
“Social media creators often obsess over the wrong metrics out of pure habit” notes Sarah Jenkins a digital strategist who analyzes thousands of accounts each year. “Our internal data shows that videos achieving a high send rate compared to their reach are three times more likely to hit the Explore page than those relying entirely on likes. The algorithm simply follows what viewers find valuable enough to share privately so optimizing for direct messages is the most effective growth lever you can pull right now.”
A 15 minute weekly routine
Checking every day mostly produces anxiety. Once a week is enough for most accounts.
Your 15 Minute Weekly Analytics Routine
How to Read and Use Instagram Insights for Business Goals
For a business, reach on its own doesn’t pay anyone. What matters is the path from seeing a post to taking an action. Look at profile visits and link taps next to reach, and compare which posts produced them. A post with modest reach and strong link taps often deserves more attention than a post with big reach and none.
Earning a profile visit is only half the battle because a cluttered profile will drive those visitors away before they even tap your link. Structuring a clean visual layout by using invisible characters for better spacing in social media bios makes your call to action stand out and directly improves your conversion rates.
If you work with brands, Insights is also your proof. Brands tend to ask who your content actually reaches, so keep a monthly screenshot of reach, the split between followers and people who don’t follow you, saves, sends and top follower locations. If you run a local business, check whether your top locations match the places your customers really are. And before you put ad budget behind a post, check whether it earned saves and link taps organically first.
Why Instagram Insights Is Not Showing
If a screen is empty or a section is missing, the cause is usually one of these.
- You are on a personal account. Switch to a Creator or Business account.
- The content was posted before you switched. Insights start counting from the switch.
- The account is too small for that section. Follower insights need at least 100 followers.
- The data is still catching up. New posts can take a while to show numbers, so check again later before assuming something is broken.
- The app needs attention. Update Instagram, check your connection, clear the cache on Android, or log out and back in.
- Permissions are limited. If someone else set up your Business account through Meta tools, your role may not include analytics.
- Instagram itself is having trouble. If everything else checks out, wait and try again.
Mistakes That Make Instagram Insights Misleading
- Judging a post in its first few hours, before the numbers have settled.
- Comparing Reels, Stories and carousels as if they were the same format.
- Mixing old Impressions figures with current Views figures.
- Celebrating one viral post without checking whether it brought follows, saves or profile visits.
- Watching likes while ignoring saves and sends.
- Changing five things at once, which makes it impossible to learn from the result.
FAQ: Read and Use Instagram Insights
Can I see Instagram Insights on a personal account?
No. Insights are available only on Creator and Business accounts. You can switch from your account settings and the change is free.
Why did Impressions disappear from Instagram Insights?
Meta replaced Impressions with Views in 2025. Views count repeat displays too, so they work like the old measure for posts and Stories, and for Reels they cover video starts and replays.
What is the difference between Reach and Views?
Reach counts unique accounts, so each person is counted once. Views count every time your content is played or displayed, so one person can add several views.
Does Instagram Insights show who viewed my profile?
No. Insights show totals and breakdowns, not the names of the people who visited.
Can I see Insights for posts from before I switched to a Professional account?
No. Insights only cover content published after the switch.
What is a good engagement rate on Instagram?
It depends on your niche and on how a tool defines engagement, so a single number can mislead. A fair method is to divide interactions by reach for each post and compare the result with your own last 30 days.
Read and Use Instagram Insights Without Overcomplicating It
If you read and use Instagram Insights once a week, ask the same three questions each time, and change one thing at a time, the numbers stop feeling like noise and start working like a feedback loop. Check who saw your content, what they did with it, and which post deserves a repeat.
Thank you for reading, and I hope this saves you some guessing. If you want a second pair of eyes on your numbers or a plan for growing your Instagram account, message me on Telegram at @membertelsupport.











Leave a Reply